
TTech OneStop · Operations
Reporting portal
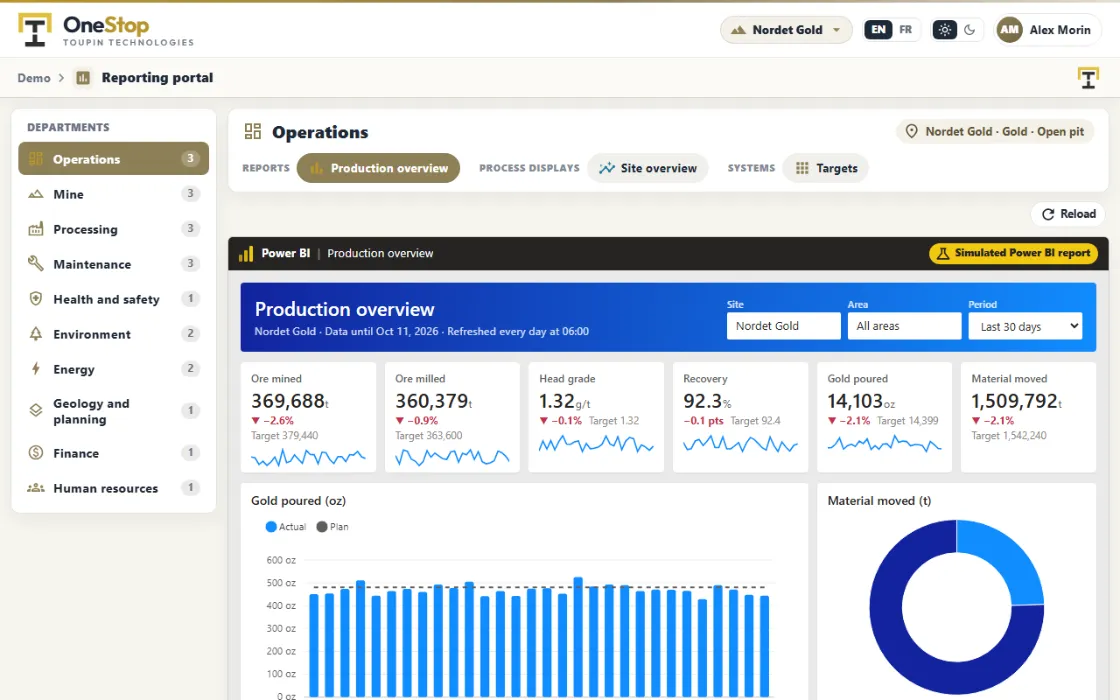
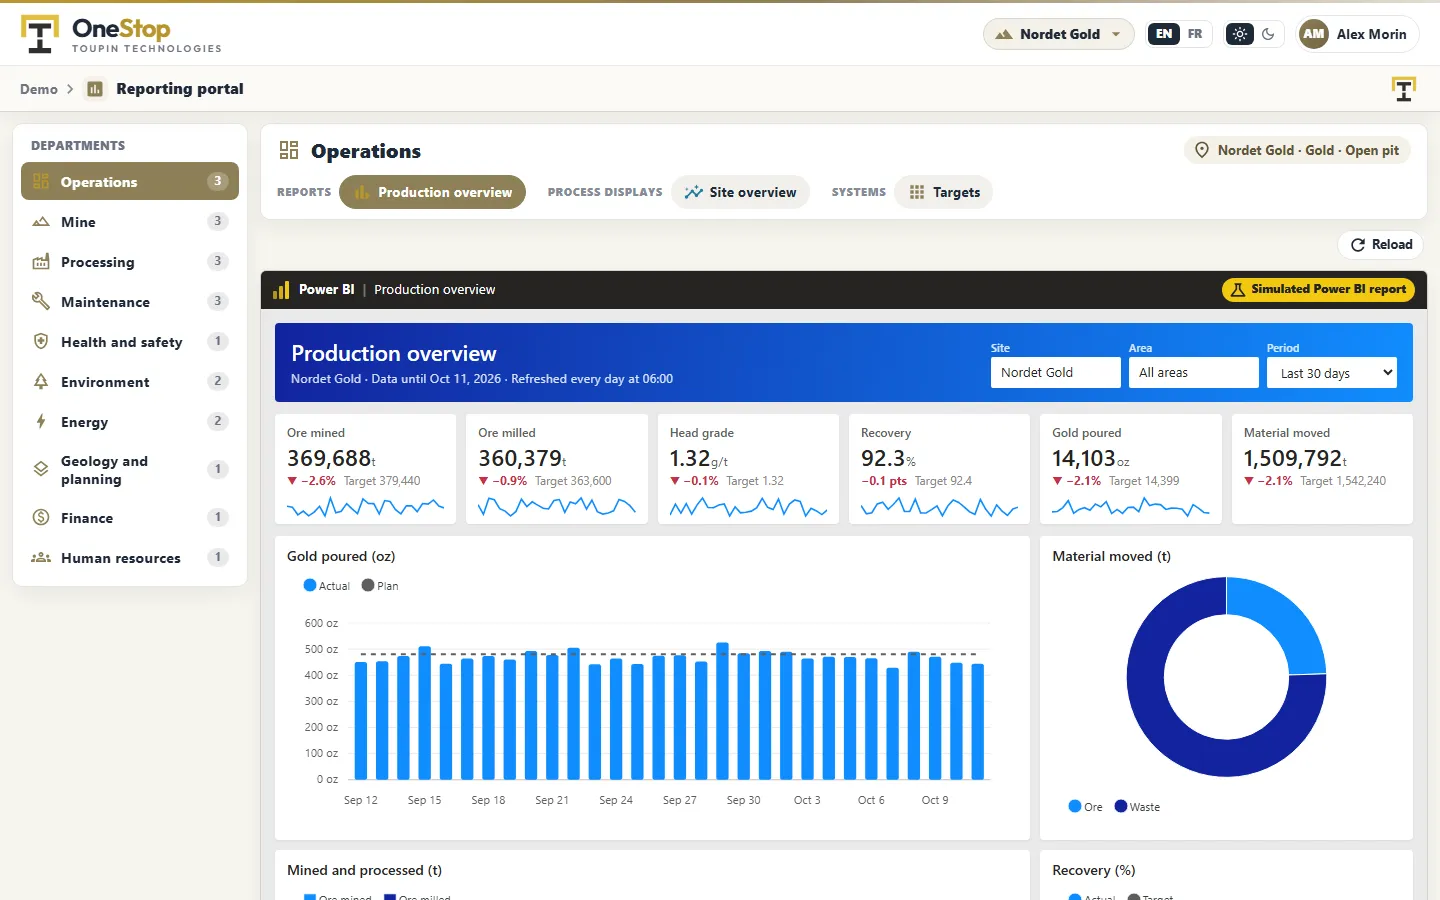
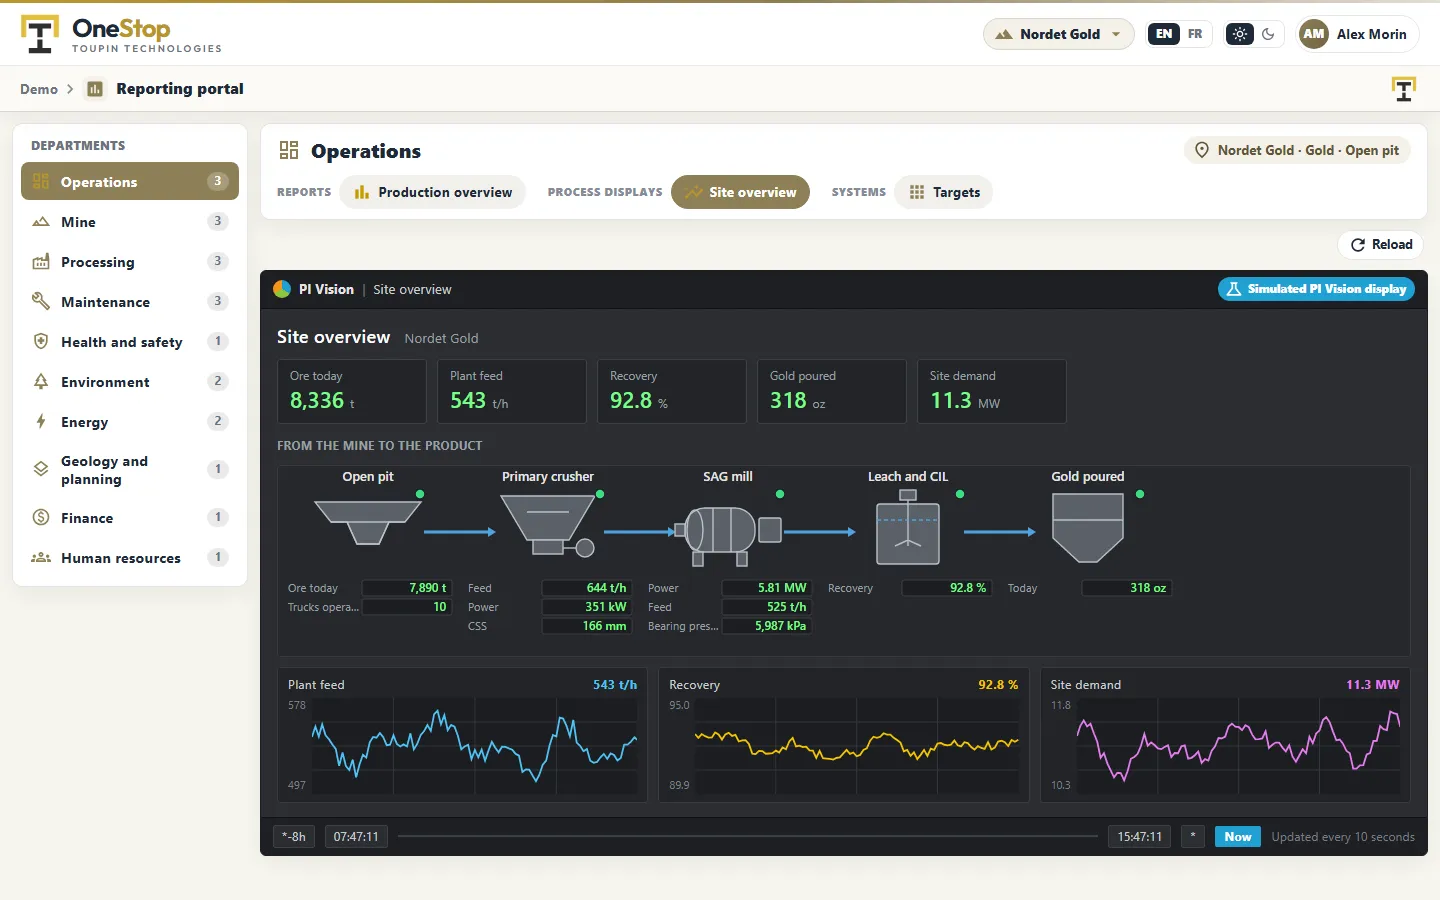
Every department finds its reports and process displays in one place, with the people to ask about them.
01The problem it solves
Good reports nobody can find.
Reports and displays are spread across Power BI workspaces, PI Vision folders and bookmarks.
New people do not know they exist, or who to ask when a number looks wrong.
02See it
03What it does
-
By department
Operations, mine, processing, maintenance, safety, environment, energy and others: each has its page.
-
Reports and displays together
Power BI reports, PI Vision displays, web pages and OneStop apps, in one list.
-
Who to ask
Each report shows its owners.
-
Set up for you
We set up the departments and their reports with you.
04Who uses it
- Everyone at the site who reads reports.
- Department heads who want their team to use the same reports.
- Report owners who want fewer "where is it" questions.
06Contact
See it on your own data.
Ask for a demo on our simulated mines, or tell us how you want to use it on yours.