
Downtime
Each stop of each sector recorded automatically, justified by the people who know why, and turned into reports.
Downtime is counted, but rarely explained.
Stops are written in shift logs and spreadsheets, each area in its own way.
Without reasons, nobody can say which equipment costs the most production.
02See it
03What it does
-
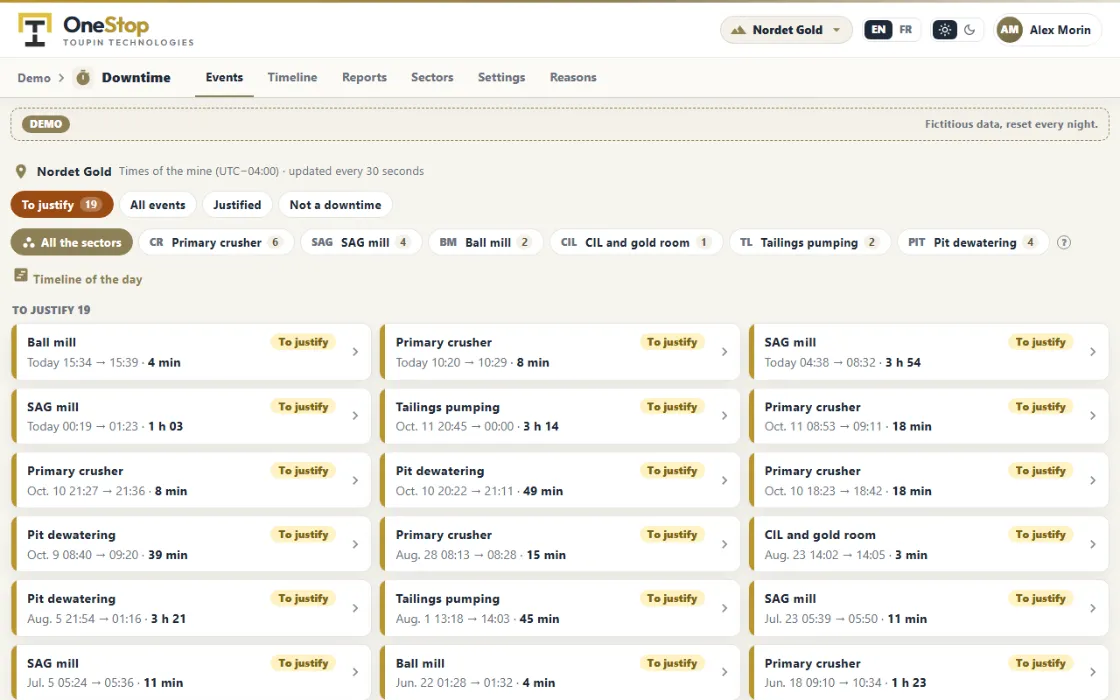
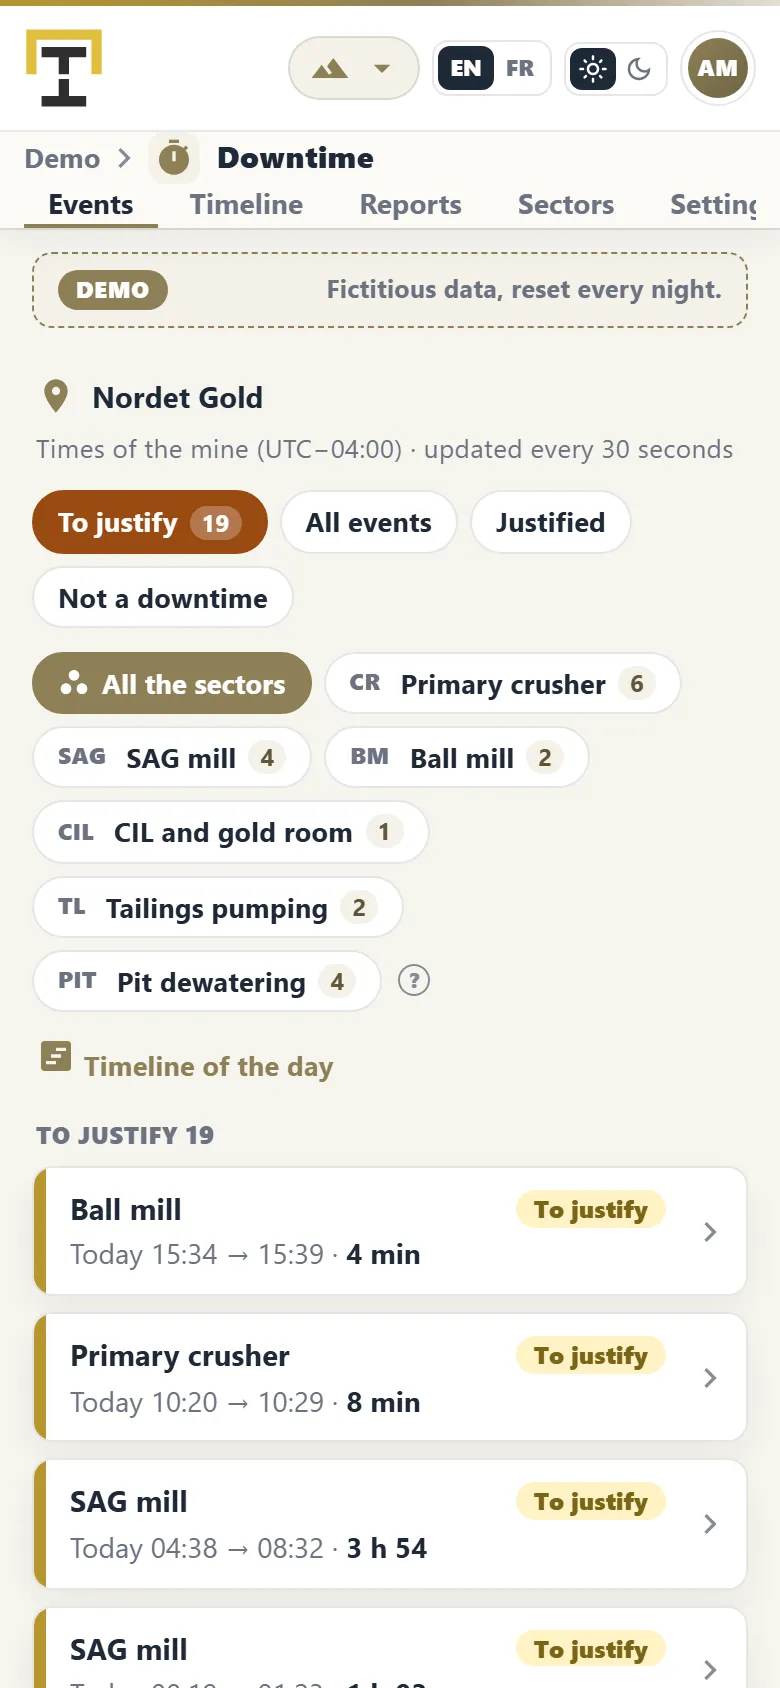
Automatic events
A trigger per sector, on a point read through AVEVA CONNECT, opens and closes each event.
-
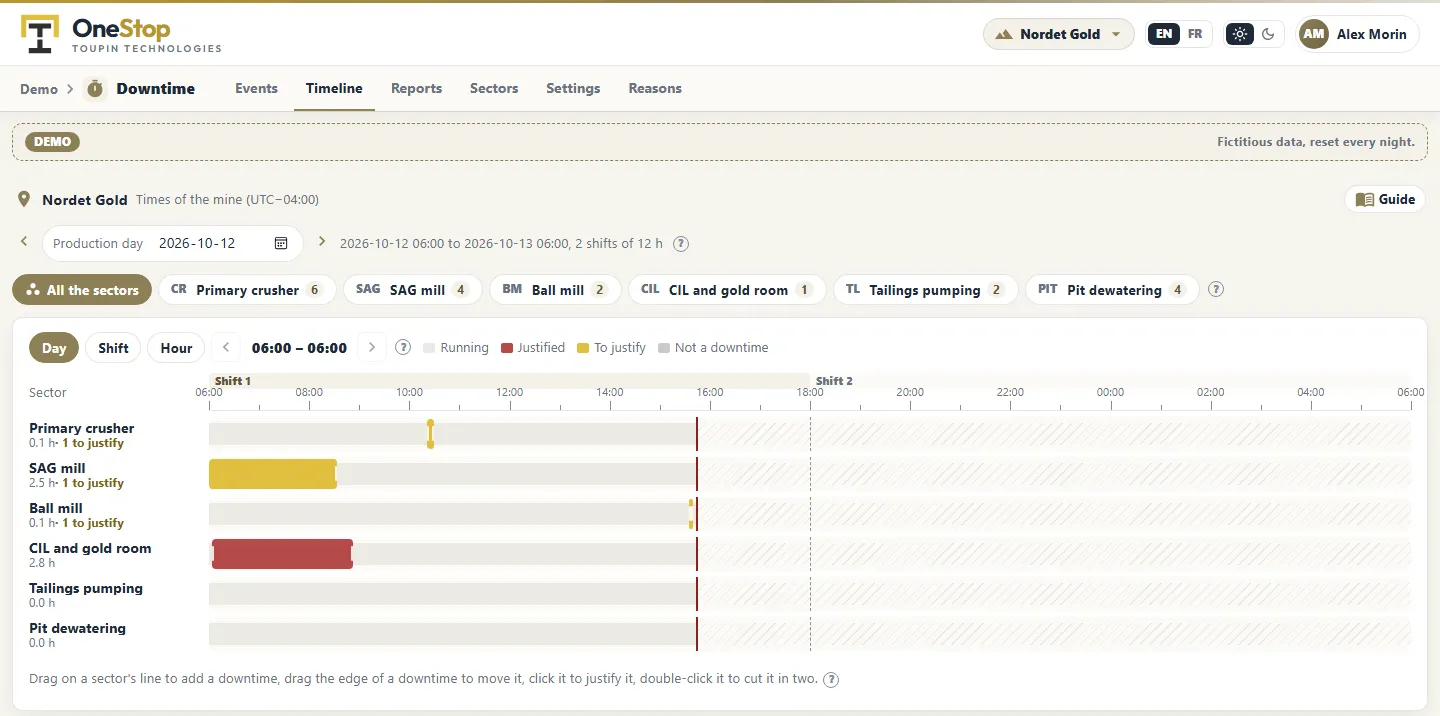
Timeline of the production day
Each production day from your site’s day start, with its shifts: the downtime of every sector and the running time between them. Zoom from the day to a shift or an hour.
-
Fast input
Drag on the timeline to add a downtime, drag its edges to adjust it, click it to justify it with your own reasons and equipment. A form with typed times does the same from the keyboard.
-
Edit what happened
Split an event, merge two, or mark it as not a downtime. Every change is kept.
-
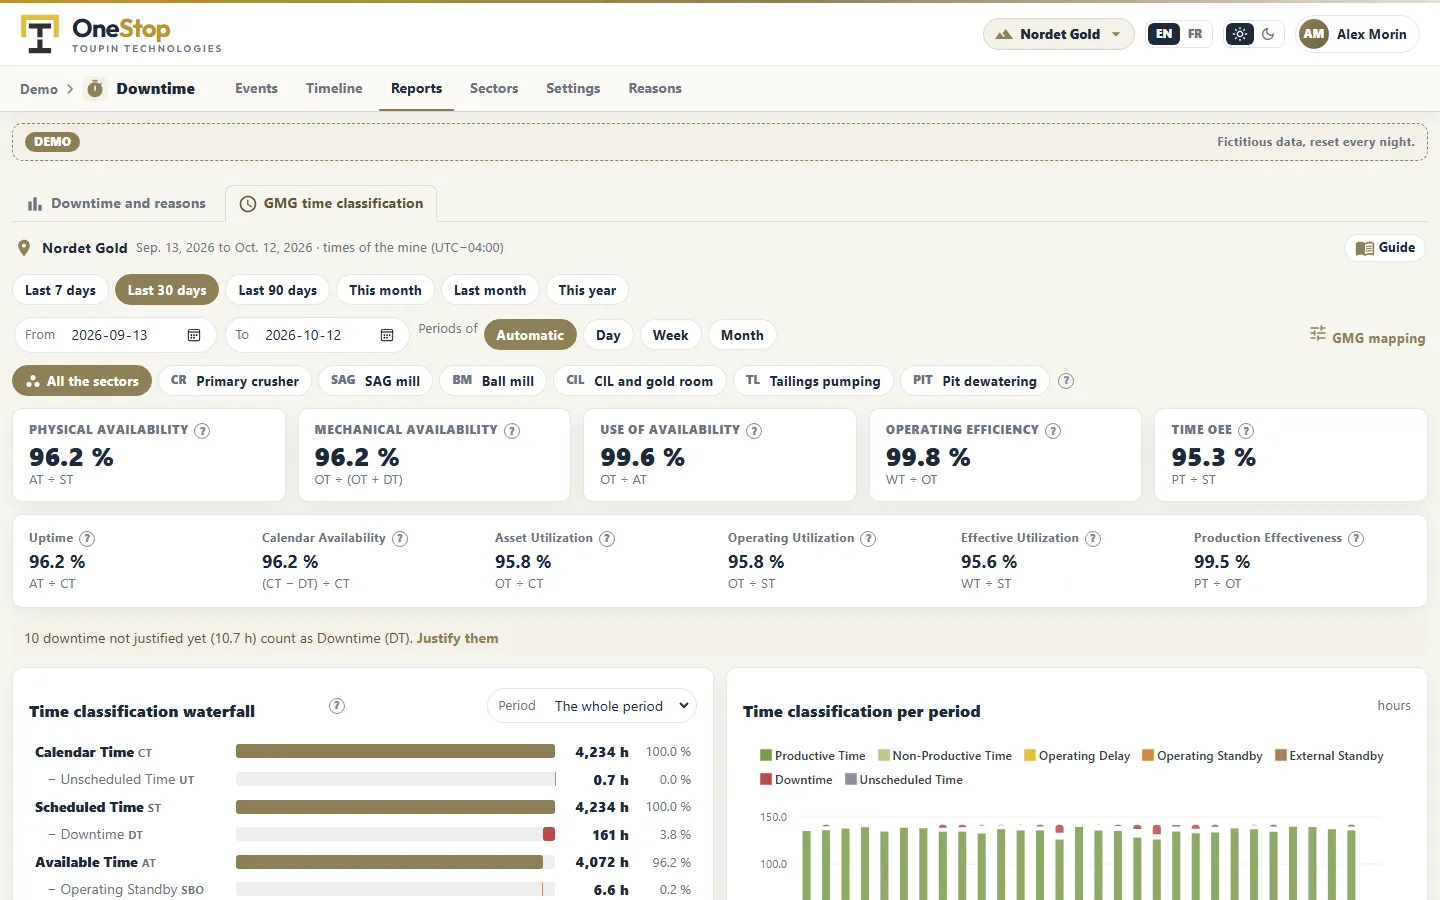
Reports
Availability, MTBF, MTTR, downtime by reason and by time category, for one sector, several or all, with an Excel export.
-
GMG time classification
Your reasons mapped to the time classes of the GMG framework: physical and mechanical availability, use of availability, operating efficiency and time OEE, with a waterfall, the time per period, the trends and the causes of each class.
04Who uses it
- Operators and supervisors who justify the stops of their shift.
- Maintenance and reliability teams who look for the causes that cost the most.
- Managers who follow availability.
See it on your own data.
Ask for a demo on our simulated mines, or tell us how you want to use it on yours.