
Reporting and self-serve data
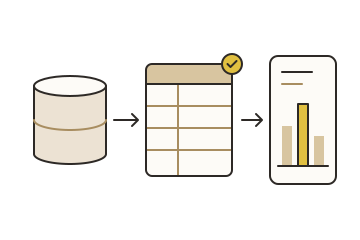
We bring PI data into your data platform as documented, governed datasets that people can use on their own, in Power BI and other tools.
Everyone builds their own extract.
Each report pulls PI data its own way, with its own filters and calculations.
The numbers do not match, and nobody knows which one is right.
02What you get
-
A data flow
From PI to your data platform through a supported path, for example AVEVA CONNECT, PI Integrator or PI Web API.
-
Curated datasets
Production, downtime, quality and energy data, shaped for reporting.
-
Documentation
What each field means, where it comes from and how it is calculated.
-
Ownership and access
Who owns each dataset and who can use it.
-
Starter reports
First Power BI reports built on the datasets.
03How it works
-
01
Pick the questions
Start from the reports that matter most.
-
02
Design the datasets
Agree names, calculations and owners.
-
03
Build the flow
Connect PI to your data platform and check the numbers against PI.
-
04
Open it up
Publish, document and show people how to use it.
04Outcomes
-
One version of the numbers
Reports use the same datasets.
-
Self-serve
People build reports without asking for extracts.
-
Trust in the data
Every value can be traced to its source.
05A good fit when
- Teams copy PI data into spreadsheets to report.
- Power BI reports disagree with each other or with PI.
- You have a data platform and want PI in it.
06Common questions
Which tools do you support?
Power BI most often. The datasets work with any tool that reads your data platform.
Do we need AVEVA CONNECT?
Not always. We choose the path that fits your systems and licences.
What is data stewardship?
Giving each dataset an owner, a definition and access rules, so people can trust it and reuse it.
Start a conversation.
Tell us about your PI System and what you need. We will suggest a practical next step.