Enhanced PI Monitoring
We watch the health of your whole PI System, so problems are found early, and not by the people who need the data.
- Included
- Health of the whole PI System, alerts, a status page, expert review
- How it runs
- A collector on your PI server, outbound through AVEVA CONNECT
- Price model
- A monthly subscription, quoted for your PI System
The problem it solves
Most PI problems are found by the people who need the data.
An interface stops, a buffer fills, a disk runs low. Nobody notices until a report is wrong or a trend goes flat.
Do-it-yourself monitoring templates help, but someone still has to maintain them and watch them.


1 · Watched The health of your whole PI System, in plain language, on one page.
2 · Found An interface stops: it shows here before a report goes wrong.
3 · Handled A specialist takes charge, and the page says so.
4 · Reported Each month: issues found, response times and availability.
Step by step, with you
From a first call to a PI System that is watched for you.
At every step you know what we do, what we need from you, and what you will see.
-
- We do
- We meet your PI and IT people, go over your PI System and agree who gets which alert.
- You do
- One meeting, and a contact for access.
- You see
- The plan: what is watched, who is called, how your status page will read.
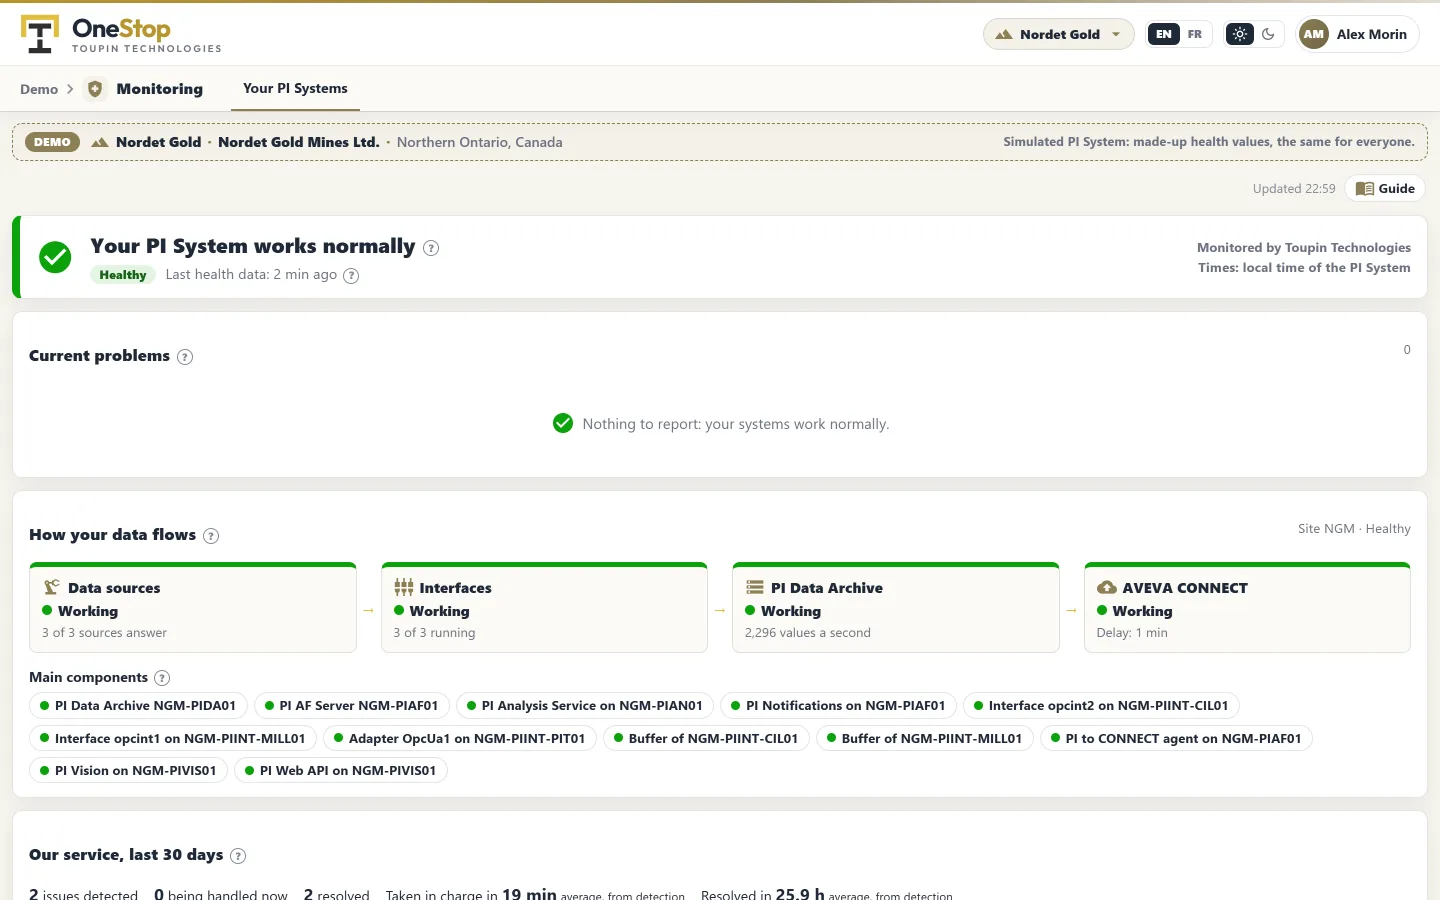
Demo section, simulated data. -
- We do
- We install the collector on your PI server. Health data leaves through your PI to CONNECT agent, outbound only: no firewall port, no VPN.
- You do
- Approve a window for the install. We do the rest.
- You see
- Your whole PI System on your status page, in plain language.
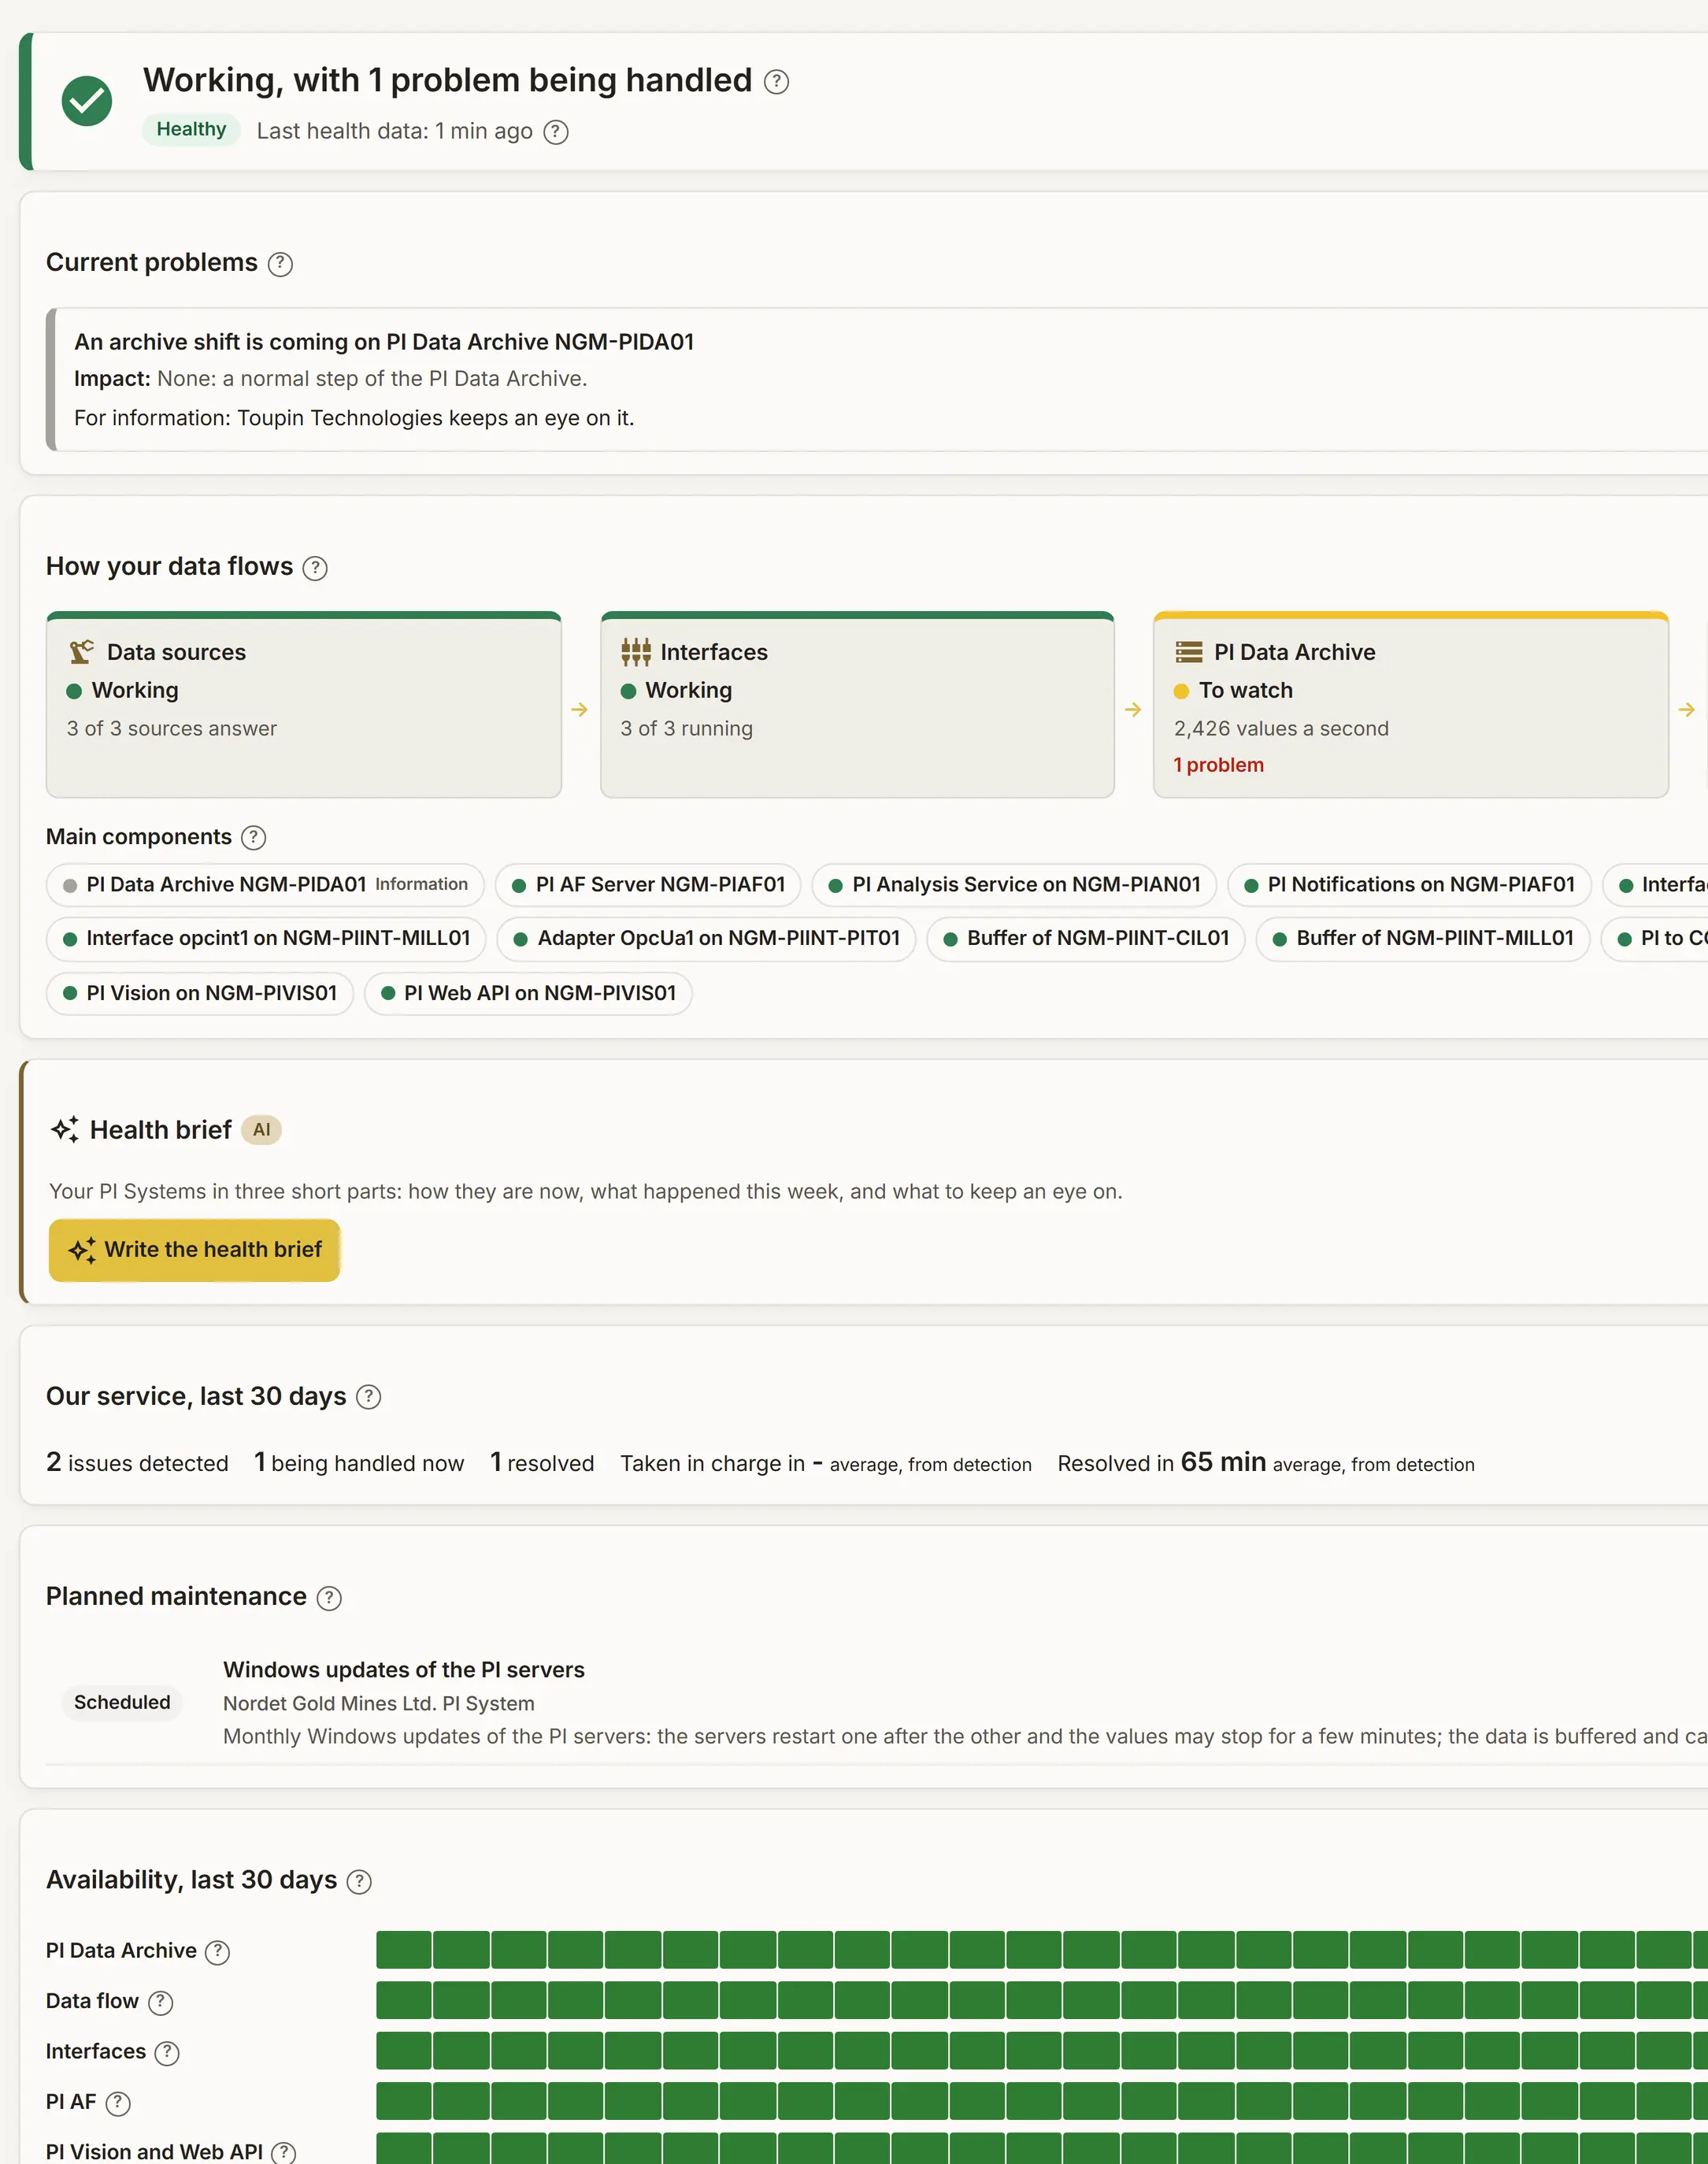
Demo section, simulated data. -
- We do
- Rules check every component continuously and open an incident as soon as something drifts.
- You do
- Nothing. If you want them, alerts reach you by email and text.
- You see
- A problem shows on the page before a report goes wrong.
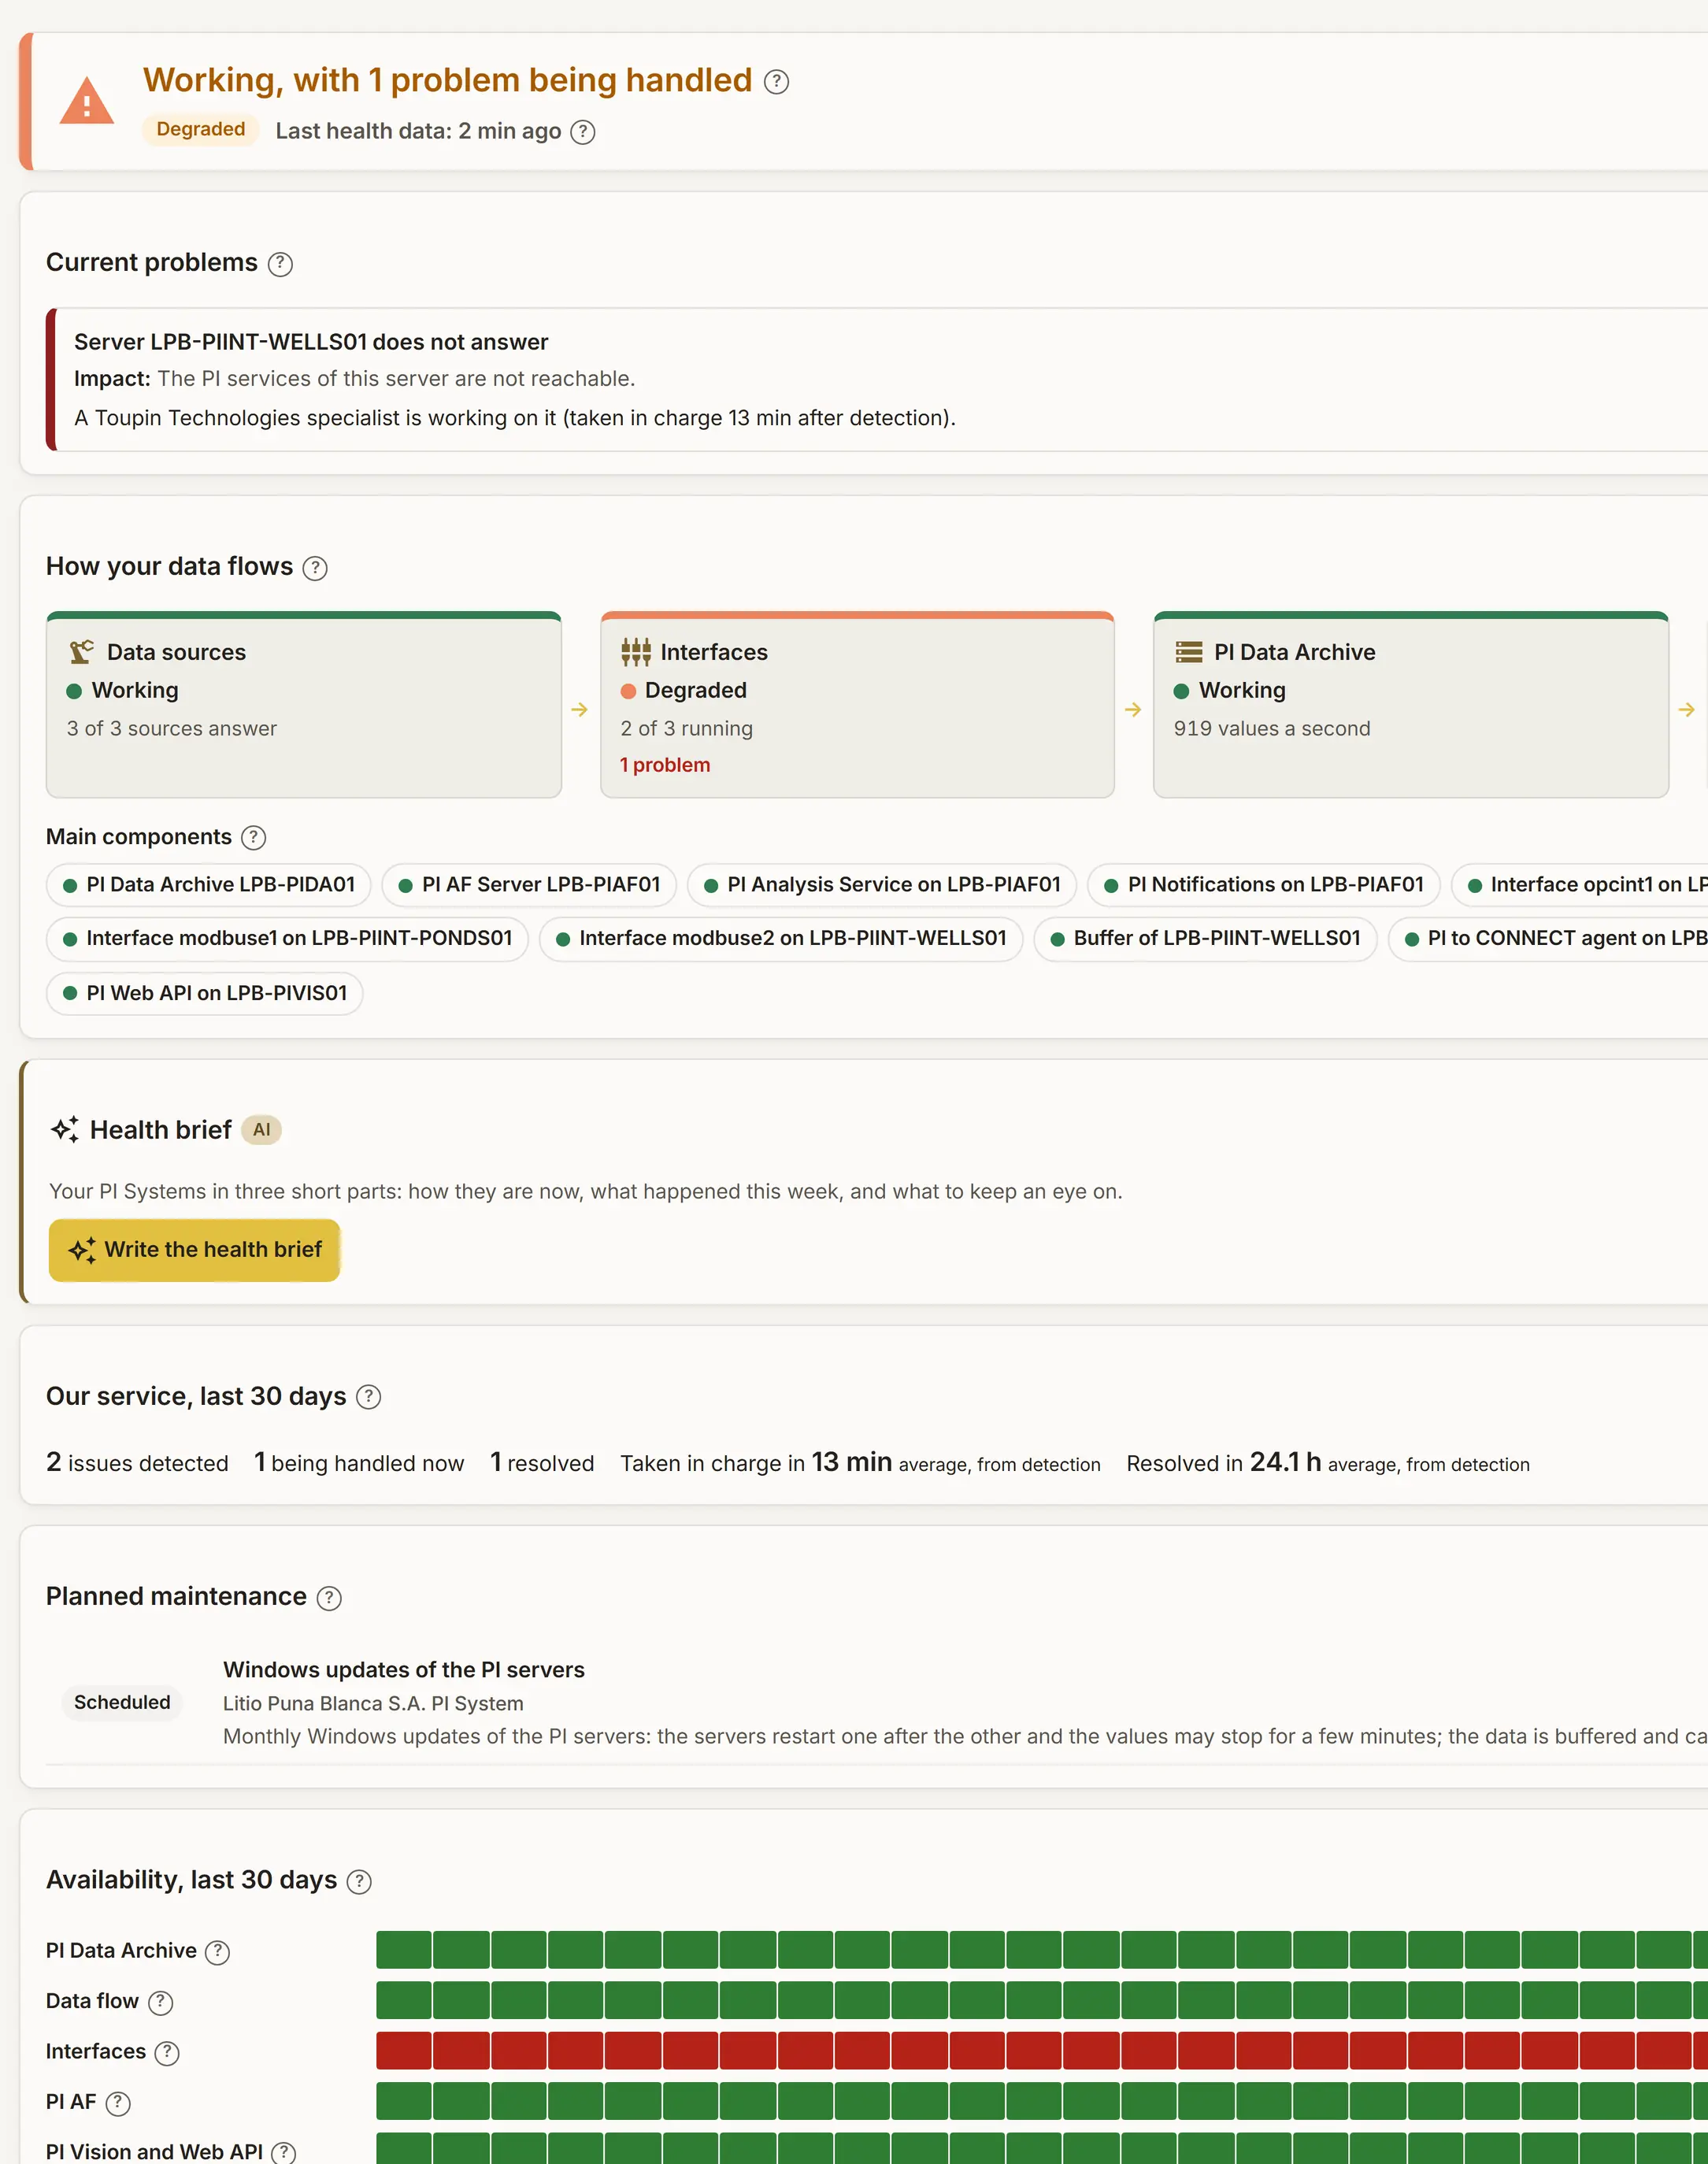
Demo section, simulated data. -
- We do
- A specialist takes charge of each problem, fixes it or guides your team, and closes it when the system recovers.
- You do
- Someone on site, only if the fix needs it.
- You see
- Who is on it, the impact and the time taken, on the same page.
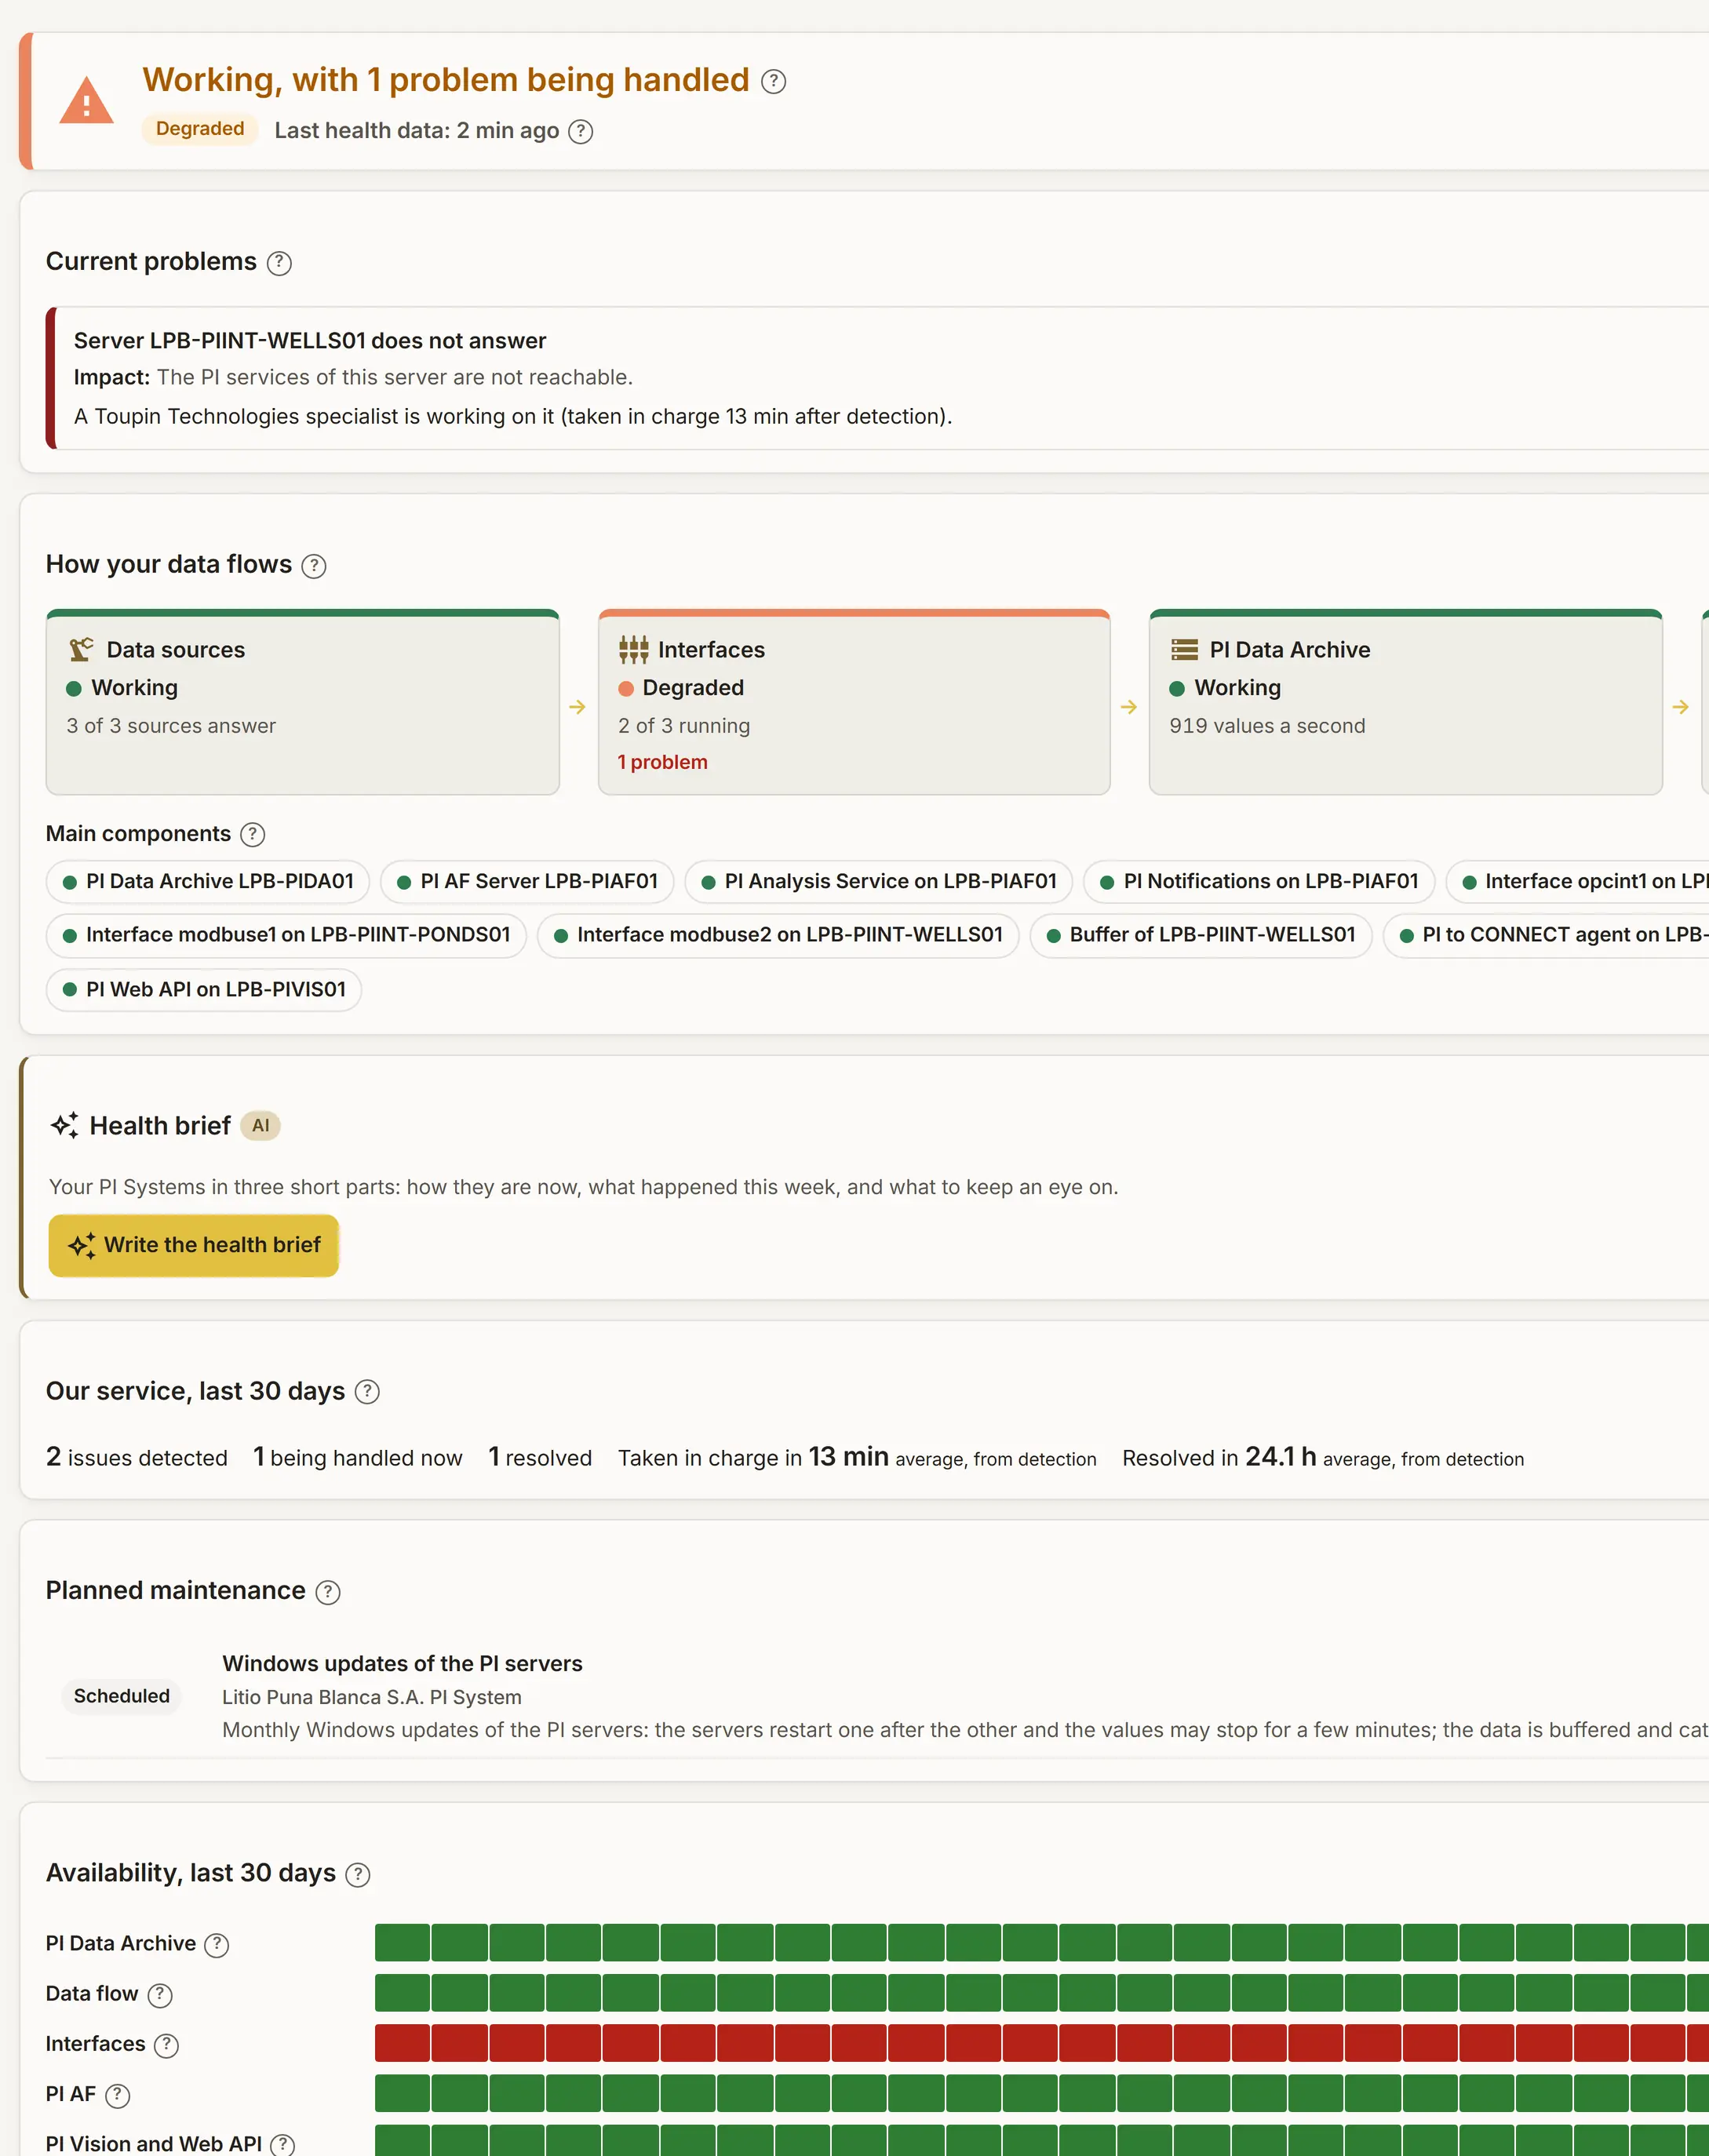
Demo section, simulated data. -
- We do
- Each month we review the incidents, the response times and the availability, and recommend what to improve.
- You do
- A short review meeting, and the decisions that are yours.
- You see
- The service report: issues found and resolved, the availability of each part of your PI System.
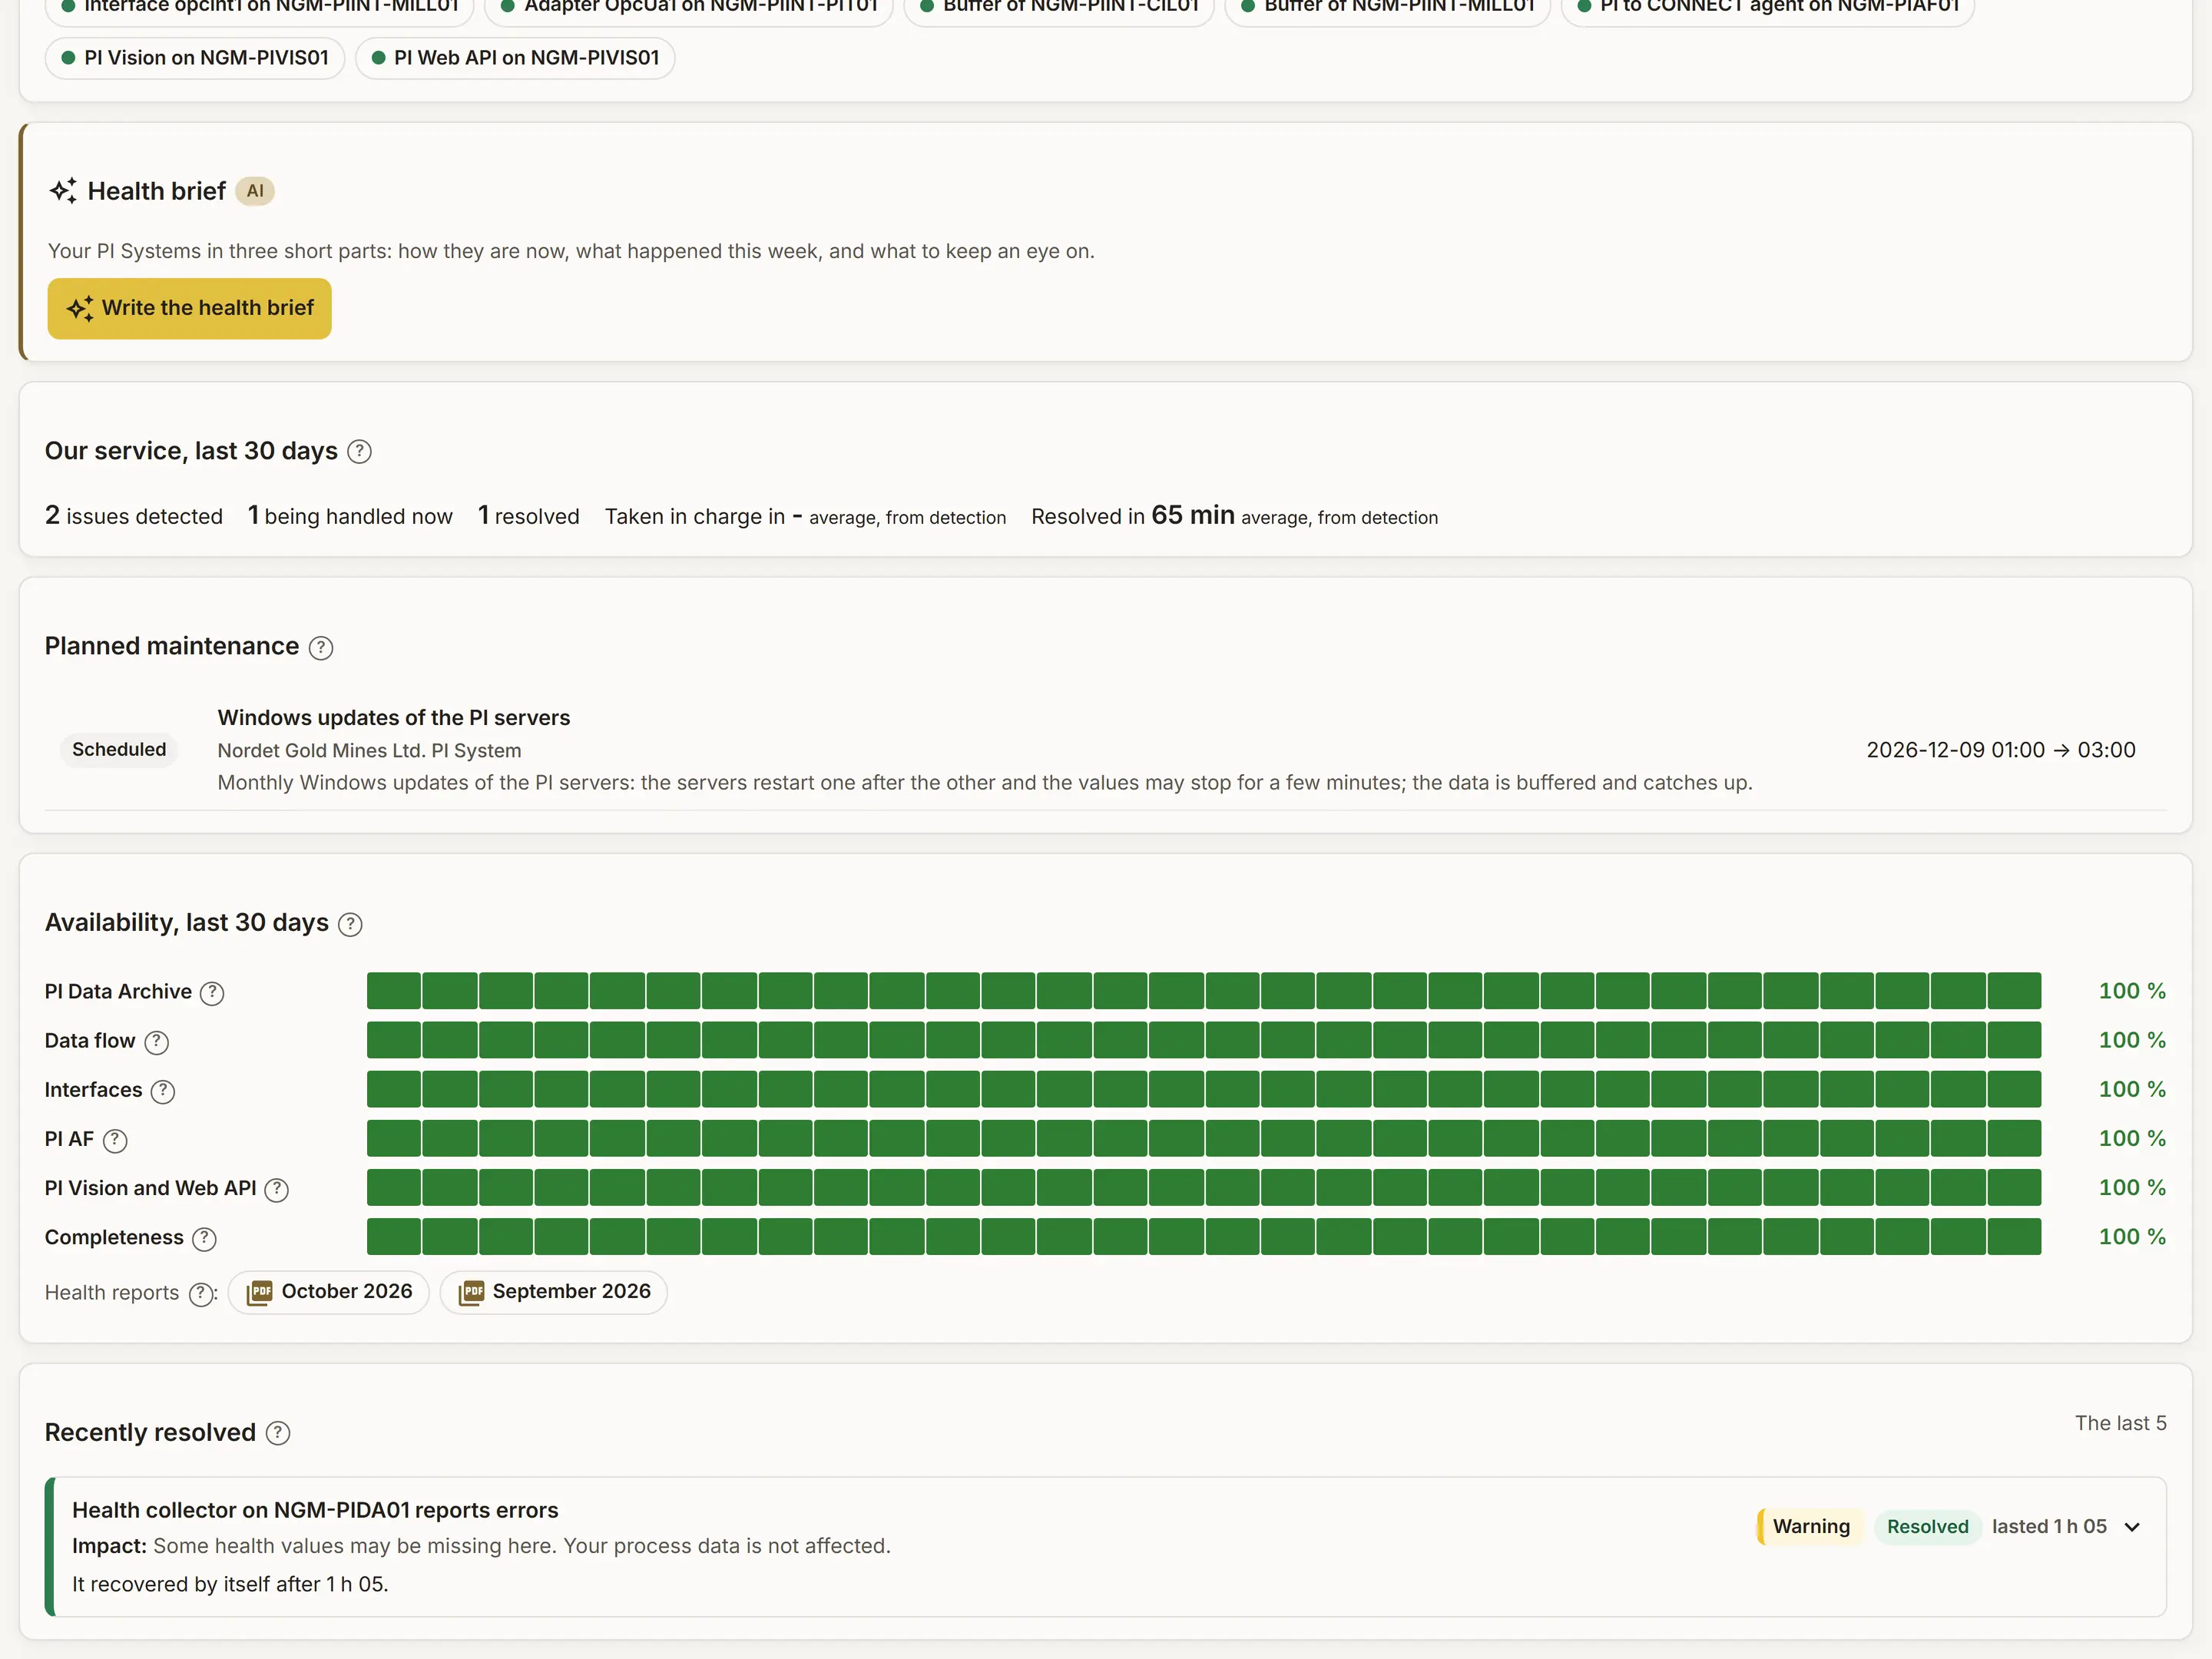
Demo section, simulated data.
What you get
-
Health of every component
PI Data Archive (archives, backups, event queue, licence), AF, Asset Analytics, Notifications, buffering, every interface and adapter, PI to CONNECT, PI Vision, PI Web API, and the Windows servers and disks.
-
Incidents and alerts
Alerts by text message and email to our team and to the contacts you choose. Incidents are tracked in Jira.
-
A status page for your site
One page in TTech OneStop: current status and open problems, in plain language.
-
Early warnings
Disks, archive space and certificates running out are flagged before they cause an outage.
-
Expert review
Our PI specialists review the findings and recommend improvements: reliability, security, capacity, compression and storage.
How it works
-
01
Install the collector
A small TTech tool on your PI server gathers health data. It adds its own health points and never changes your existing points.
-
02
Send it through AVEVA CONNECT
Health data leaves through your PI to CONNECT agent, outbound only. No inbound firewall port, no VPN.
-
03
Watch and alert
Rules open incidents, send alerts, and close them when the system recovers.
-
04
Review and recommend
Regular reviews turn findings into concrete improvements.
Outcomes
-
Fewer surprises
Problems are seen when they start, not when a report is wrong.
-
Less effort for your team
No monitoring templates to build or maintain.
-
A healthier system over time
Recommendations improve reliability, security and storage, step by step.
A good fit when
- Your PI System feeds production reports, control-room displays or other systems.
- Your team has no time to watch interfaces, buffers and backups.
- You have just gone live and want close attention while things settle.
Common questions
Does it change our PI System?
It adds its own health points and a small collector service. It never changes or deletes your existing points. The health points use your point licence; the count is shown before anything is created.
What do we need on our side?
AVEVA CONNECT with the PI to CONNECT agent, and a read-only CONNECT access for our team. Nothing reaches your network from outside.
How is it priced?
A monthly subscription, quoted for your PI System: its servers, interfaces and the contacts to alert. No long setup project.
How does it fit with Hypercare and the helpdesk?
After a go-live, Hypercare can start with monitoring in place. Add the PI Helpdesk so the same team fixes what monitoring finds.
Start a conversation.
Tell us about your data and what you want from it. We will suggest a practical next step.