
Targets
One trusted list of your production targets, by section and by period, that reports and dashboards can read.
Targets live in too many spreadsheets.
Budget, plan and guidance values are copied from file to file, and reports disagree.
A missing period or two values for the same day go unnoticed until month-end.
02See it
03What it does
-
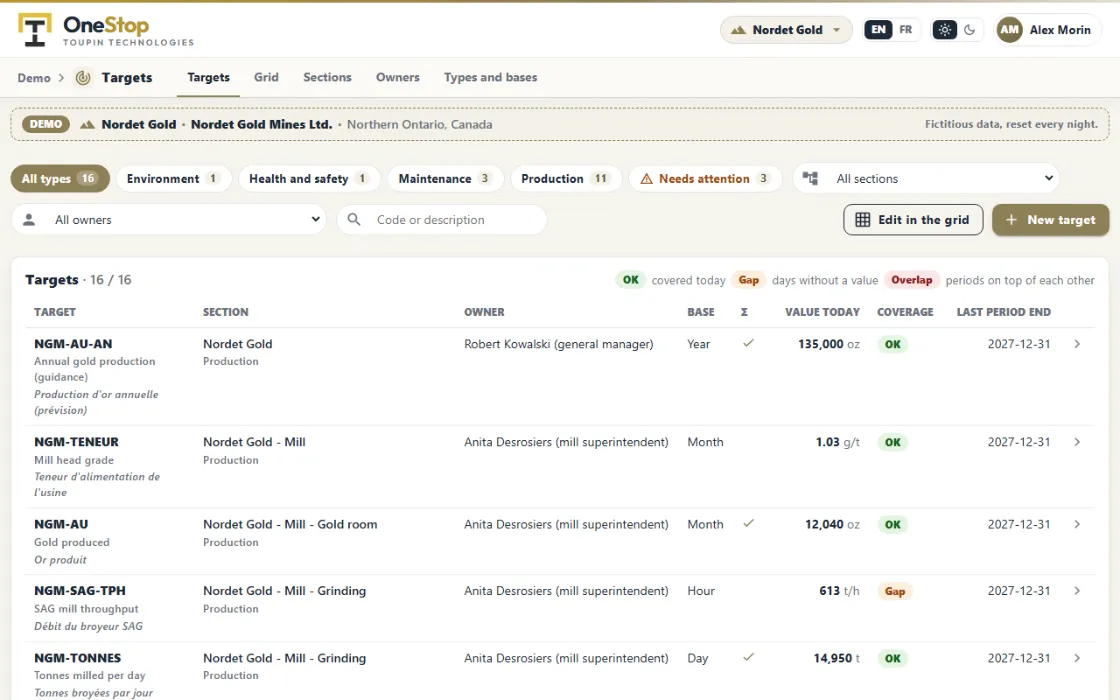
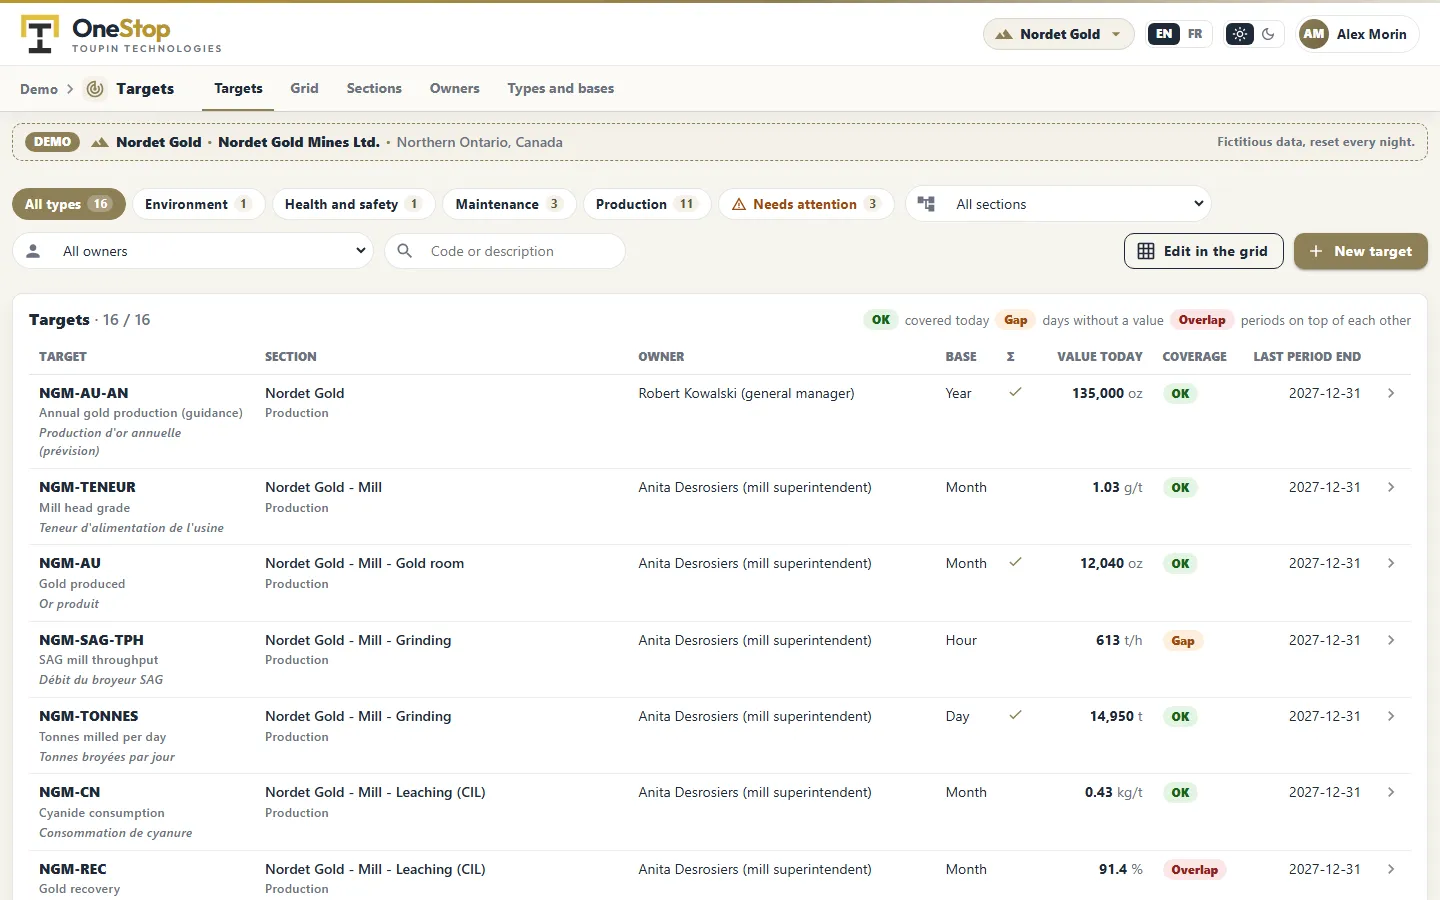
Targets by section
Each target belongs to a section of your mine and to an owner.
-
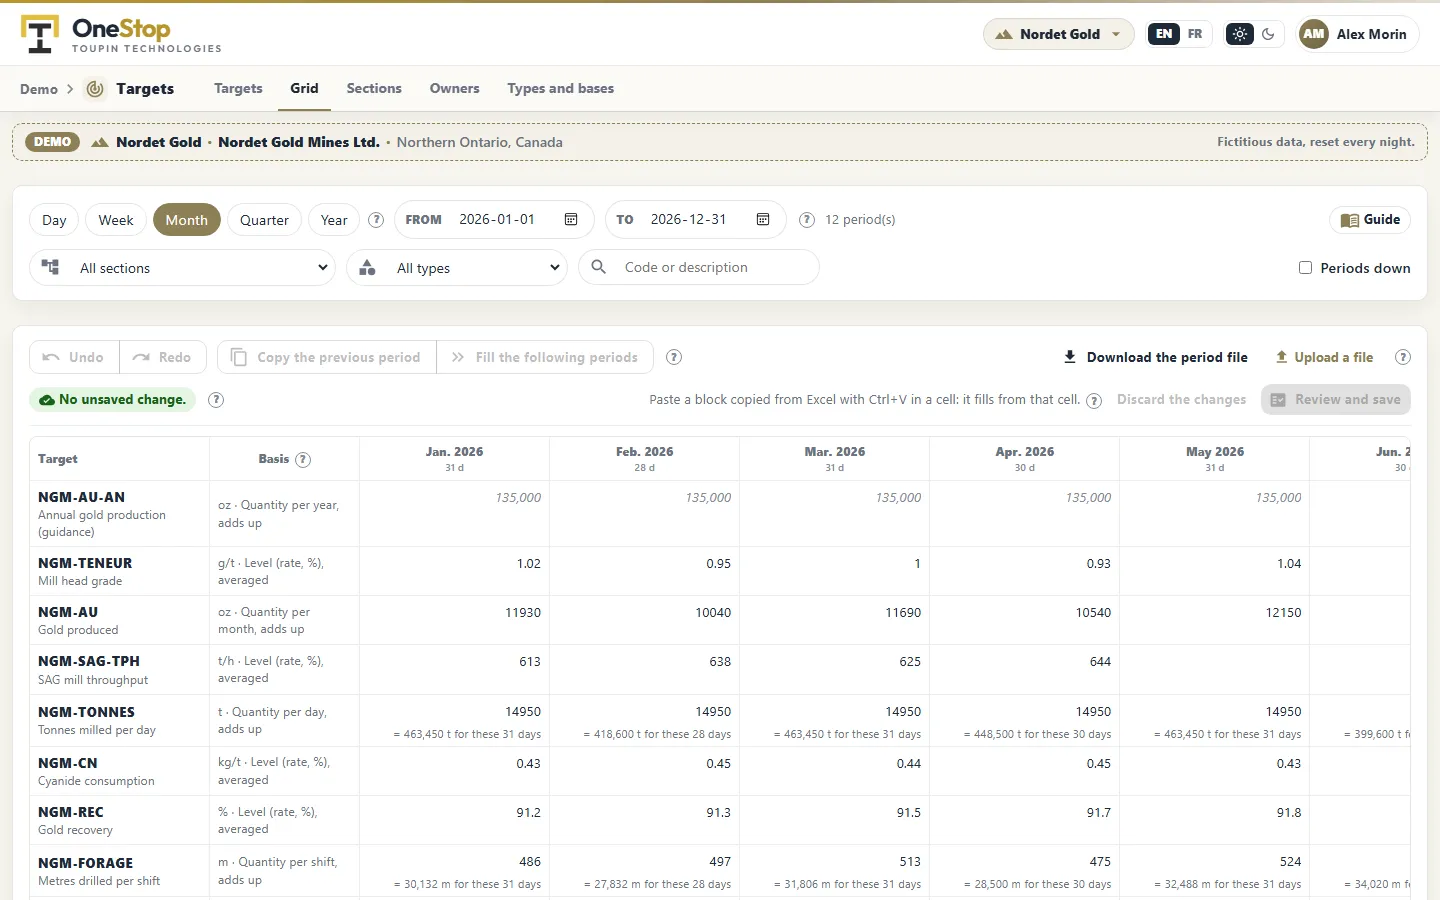
A grid like a spreadsheet
Choose the periods (day, week, month, quarter or year) and type the values, or paste a block copied from Excel. Undo, copy the previous period and fill the following ones.
-
Excel period file
Download the targets and periods as an Excel file, fill it and upload it. A preview shows the new, changed and invalid values before anything is saved.
-
The basis of each value
Each target shows its unit and how its values count: a quantity that adds up, per period or per day, or a level that is averaged, with the total of the period beside it.
-
Coverage checks
Gaps, overlaps and targets with no value today are flagged.
-
Daily values
Each target is spread per production day, so reports can compare actuals with the target.
04Who uses it
- Planning and finance teams who own the targets.
- Report builders who need one source for targets.
- Managers who compare production with the plan.
See it on your own data.
Ask for a demo on our simulated mines, or tell us how you want to use it on yours.