
Predictive maintenance
A health index for each pump, from the PI points you already have, with plain explanations and warnings before a failure.
Pumps fail between two inspections.
Vibration, temperature and flow are already in PI, but nobody watches every point of every pump.
A worn impeller or a bearing that heats up shows in the data days before it stops the plant.
02See it
03What it does
-
Pump curve
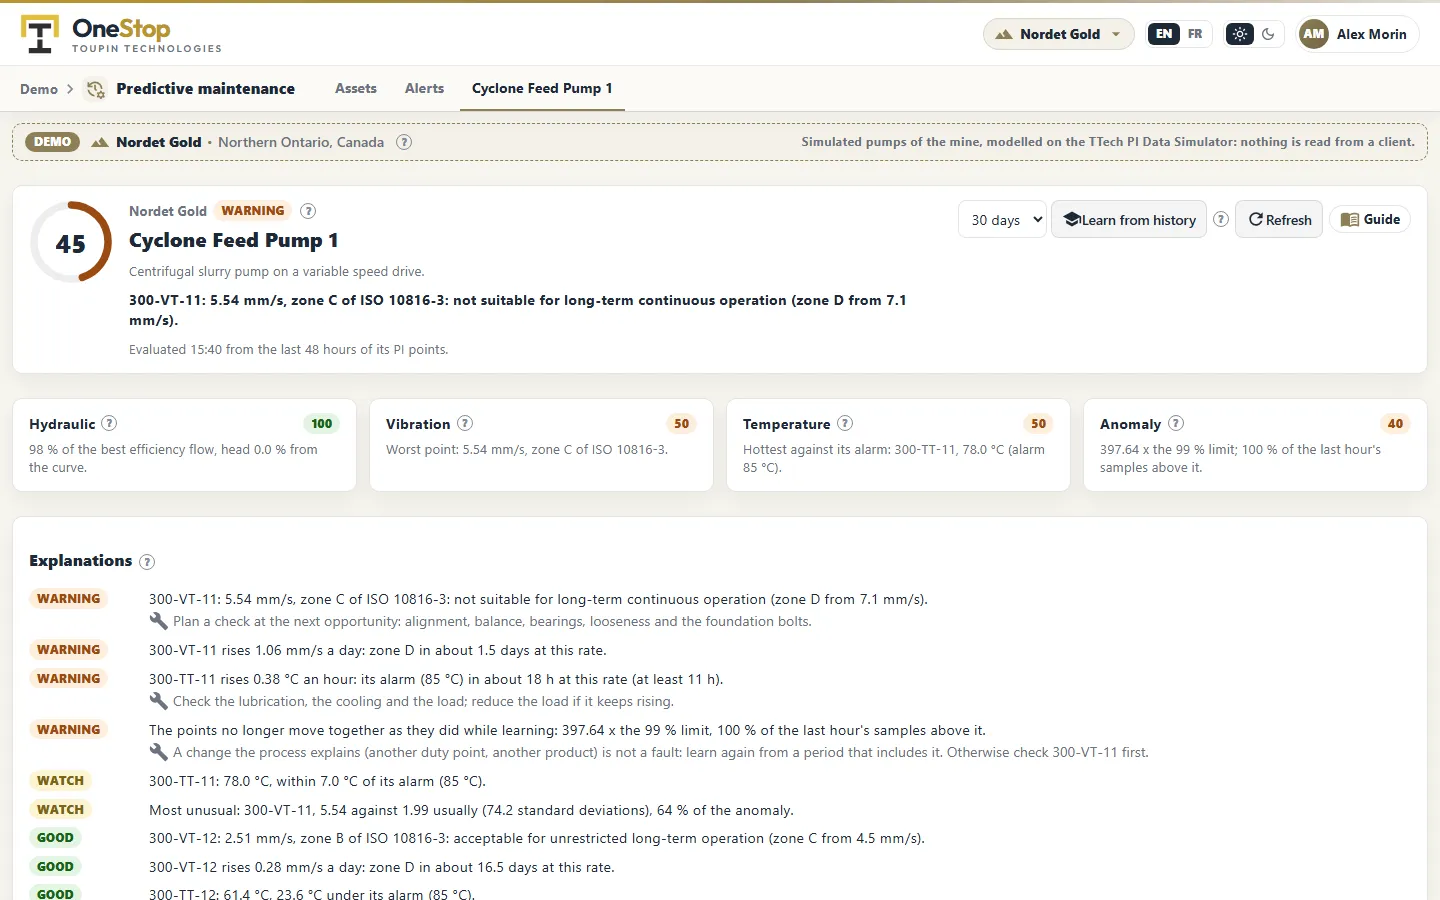
Flow and head against the pump curve and its best efficiency point, at the current speed.
-
Vibration
Zones of ISO 10816-3, the trend, and when zone D will be reached at this rate.
-
Temperatures
Bearing and motor temperatures against their alarm and trip, with the time left to the alarm.
-
Multivariate anomaly
A model learns how the points move together and shows which point makes the pump unusual.
-
Health index and alerts
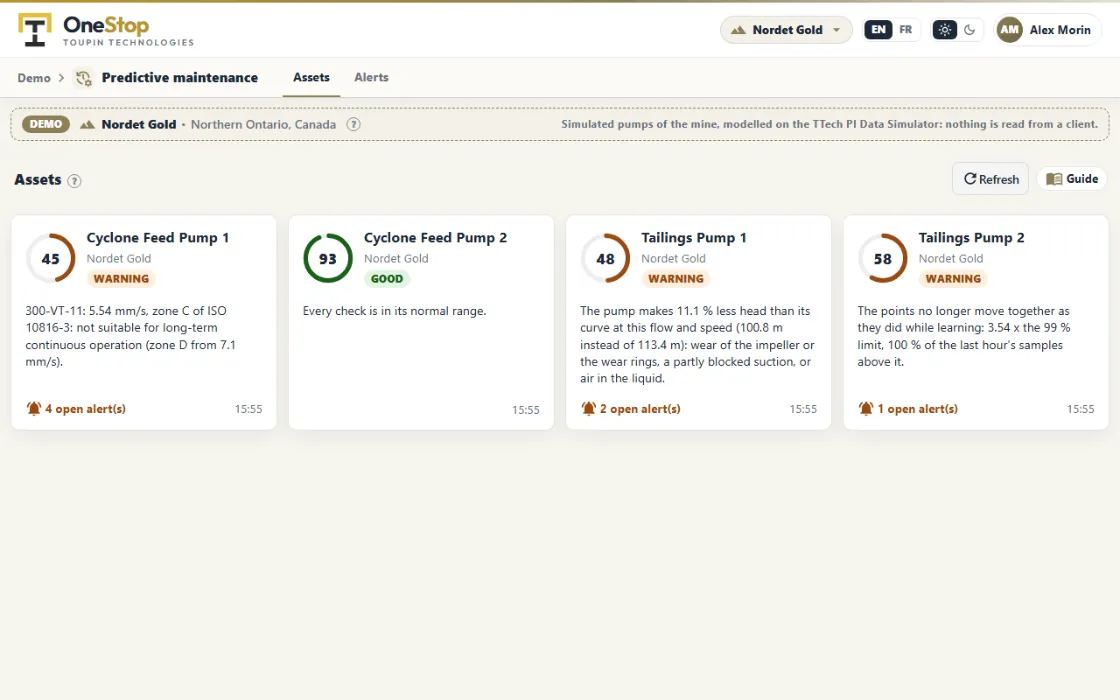
One score per pump, explanations in plain words, and alerts to acknowledge.
04Who uses it
- Reliability and maintenance engineers.
- Maintenance planners who decide what to check at the next shutdown.
- Plant operations who want fewer surprises.
See it on your own data.
Ask for a demo on our simulated mines, or tell us how you want to use it on yours.