
Monitoring
One page that tells you, in plain words, whether your PI Systems work, what is wrong and what is being done about it.
People who need PI data cannot see if PI is healthy.
When a trend goes flat, users do not know if the process stopped or an interface did.
The answer is usually in server tools that only the PI administrator opens.
02See it
03What it does
-
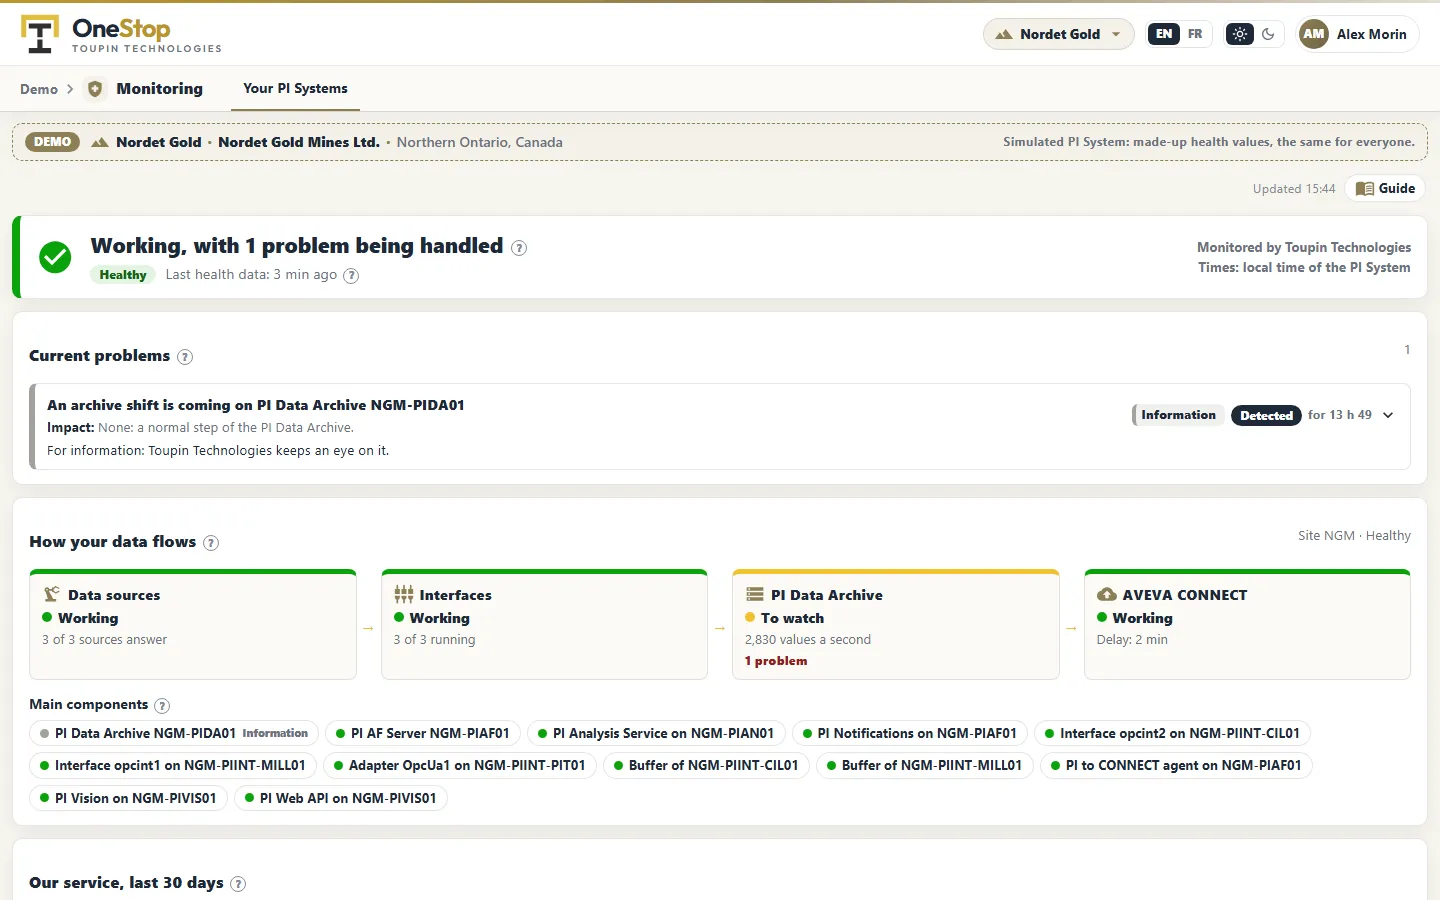
A clear status
Either nothing to report, or the problems being handled, each explained: what it means and what it affects.
-
How your data flows
A diagram of your PI System, from interfaces to users, and its main components.
-
Recently resolved
The last problems fixed, with the time to take them in charge and to resolve them.
-
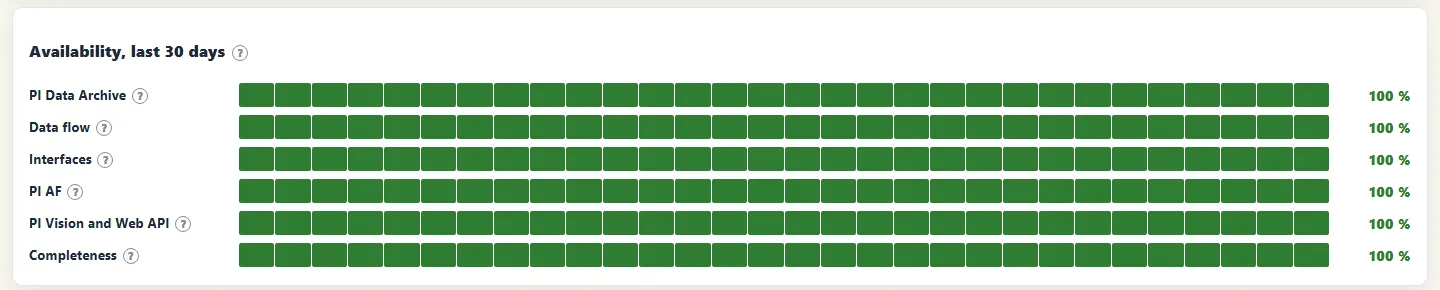
Availability and reports
Availability over the last 30 days, monthly health reports in PDF, and a weekly summary by email if you want it.
-
Notes from our team
With Enhanced PI Monitoring, our specialists add notes and the problems they see coming.
04Who uses it
- Process and reliability engineers who rely on PI data.
- Managers who want to know, without asking, if their data can be trusted.
- IT and OT teams who share the support of the PI System.
See it on your own data.
Ask for a demo on our simulated mines, or tell us how you want to use it on yours.